Profiling: 4th aspect of Observability?
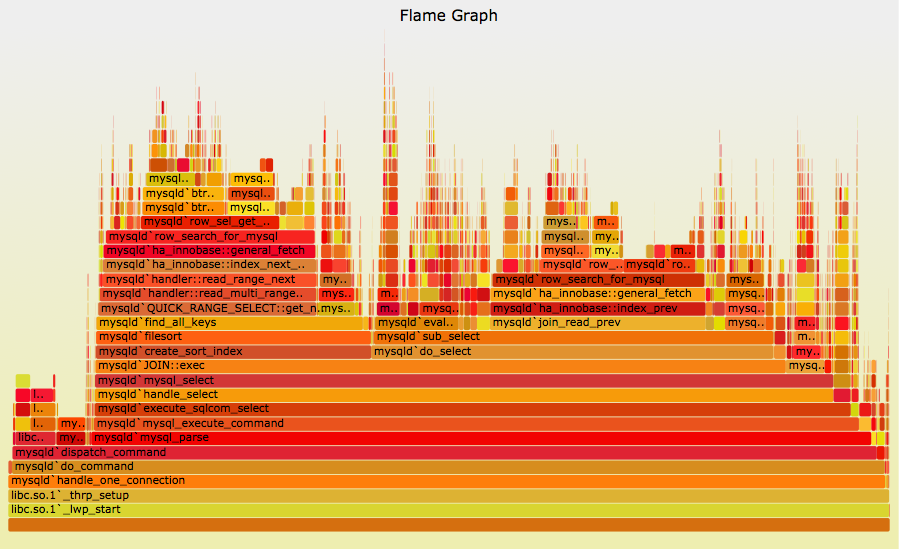
Flamegraphs are a new addition to profiling: Courtesy of Brendan Gregg
Profiling an application means to observe the memory and cpu utilization of the machine, in which the software runs. Profiling is one of the aspect of Observability - apart from Logging, Tracing and Monitoring.
Profiling has been used from a long time, and each programming language either provides inherent support for Profiling(for example Golang), while some tools exists for profiling your application.
To profile an application, it would mean to collect the stack trace of the call sequence, that led to execution of a function. We collect these stack traces and then combine them as profiles, so that we can use to visualize the amount of resources consumed, for that type of resource. Each of the stack trace contains resource metrics, which are useful in understanding the function level allocation of resources.
There are different types of resources that we can collect profiles for, so it depends on the user, what sort of profiles they want to collect, to observe the system.
Why use Profiling?
Profiling is useful as a debugging resource. Particularly, when you application needs to be observed, you would need to check how much CPU and RAM your application is using. This also means that you would need to check your logs and metrics to see what happened.
You would want to observe your application, if -
- Application uses more resources, than it is supposed to use.
- You application is facing a downtime, OOM killed.
- You want to optimize your application, and reduce the time and space allocation.
Profiling helps in 1 and 3. For 2, you would need Continuous Profiling, which I would be talking more in my next blog.
You can run your application with profiling enabled, easily check the profiles, and see the resource allocations made by a specific functions/part of code, and then investigate your codebase to optimize your code. It eases the toil of figuring out which part of code has a higher resource utilization, and refactor the code to regulate the utilization.
How can I try Profiling?
Some languages make profiling as easy as running a command - In go you can do for CPU profiling -
import _ "net/http/pprof"

func main() {

    f, err := os.Create("name_of_profile")
    if err != nil {
        log.Fatal("could not create CPU profile: ", err)
    }
    defer f.Close() // error handling omitted for example
    if err := pprof.StartCPUProfile(f); err != nil {
        log.Fatal("could not start CPU profile: ", err)
    }
    defer pprof.StopCPUProfile()
    // your code from here
}
Continuous Profiling: A Way for Observability
Normally, profiling would mean that you can collect snapshots and compare them when an incident happens, or if you are making a release, you can compare the resource allocations between 2 versions, and see it for yourself, if some changes bring in a drastic changes.
But what if, you could consider continuous collection of profiles, much like metrics, and use them to observe your application? This is a win-win situation, since storing data on cloud is dirt cheap, and you can use them to observe and pin point bottlenecks and optimise the application.
Continuous Profiling gets better, if you want to investigate your application just before it gets OOM killed. Especially, if your application does not use web servers, it can be difficult to enable continuous profiling(atleast for Go). So all in all, if you use a continuous profiling service, we can collect profiles at a certain time interval, and as a debugging mechanism, we can see the aftermath that cause the application to OOM out.
Continuous Profiling Solutions
Continuous Profiling isn't a new concept, it is been in the market for a long time. There are few providers, which provide Continuous Profiling as a Service; you can run the profiling client, which would scrape the profiles from your application, and a Profiler Service, which could run and compute all the calculations and show you the resource allocations.
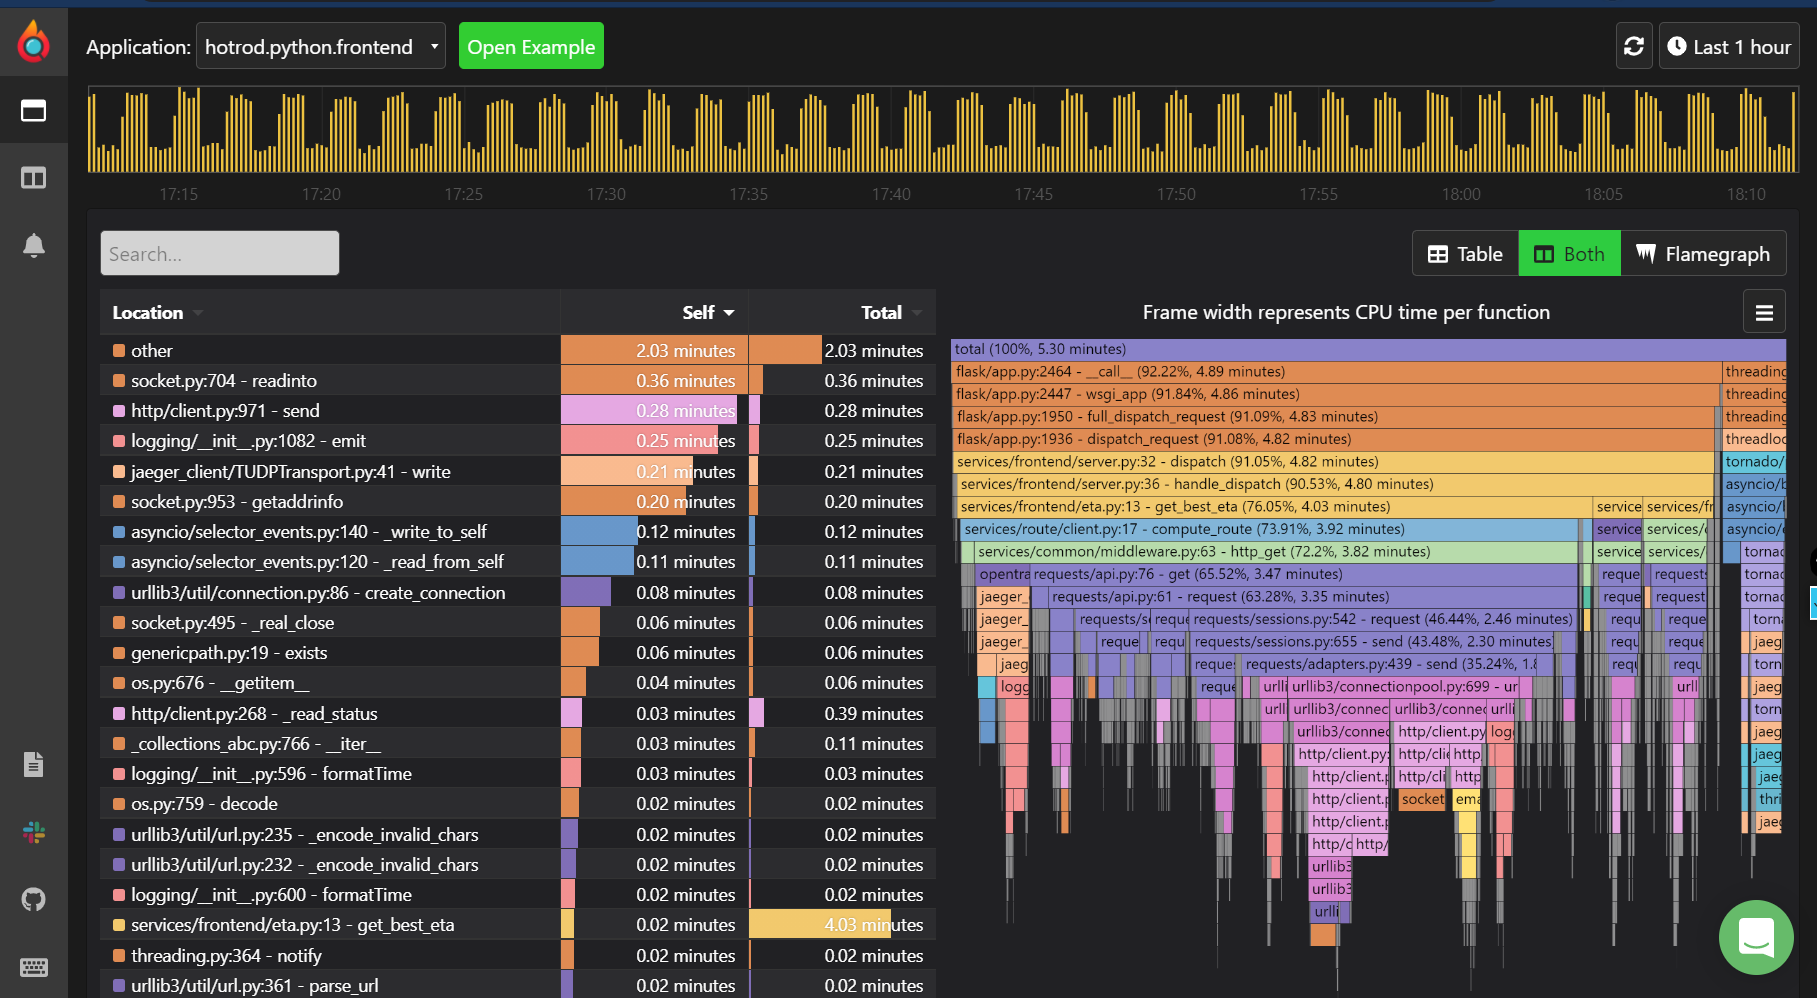
Pyroscope: Open Source provider for Continuous Profiling
There are bunch of Continuous Profiling providers that I know -
- Pyroscope - pyroscope.io
- conprof - https://github.com/conprof/conprof
- Polar Signals - https://www.polarsignals.com/
Should you use Continuous Profiling?
Continuous Profiling helps, especially you are working with microservices, and you want to get to the root of the problem. It is difficult to debug issues with distributed systems, and distributed observability monitoring helps you reduce the toil. Profiling is another dimension of observability, and the amount of features with the limited overhead, means that profiling should be a no brainer!
I would be writing some more posts under Notes section, about profiling and my experience with working with Pyroscope for setting up a demo project that demonstrates the conjoined advantage of Logging/Tracing/Profiling.